Sunday, December 22, 2013

Activate Prompt

Looking at the blog it looks like I retired from teaching! Disappointing oreo lesson and I'm out. I think this has been my most extended blogging absence...

.. and this is only a brief return. But there should be more posts coming if I get a chance to write up all the stuff I was doing.

Matt Enlow tweeted: One of my favorite Geo lessons of the year: Put down the iPads. Let's talk. How could we define the "center" of a triangle?

I responded: wish would put together one of his cool electronic samplers for that.

Dan asked: “Electronic samplers”? (I meant like his Ice Cream Stand Future Text)

Matt explained: Maybe Ss are given a series of ∆s and asked to click where they believe the "center" to be? Then show all marks at once

But Christopher  saved the day: That is easy in activeprompt. No need to involve Mr. M

Oh, yeah! ActivePrompt. Riley Lark's cool programming venture for making interactive polling diagrams that I always meant to do but never got around to doing. Pretty quickly - with a slight distraction of making a GeoGebra sketch with tools to find four of the centers - I put together three prompts. Want to try them? (If you're an early reader, don't expect much of the results!) (EDIT: turns out the responses are only visible if you're logged into Active Prompt. After a few responses accumulate I'll post the pictures. Try the polls though!)

Poll and Results

Poll and Results

Poll and Results

I'm pretty curious to see the results! Want to compare to the geometric centers? Here are those images.

Thanks, Matt, Christopher, Dan and Riley. Now that I've blogged about it, I'm sure I'll remember ActivePrompt next time.

Monday, October 28, 2013

My Oreo Lesson

Finally... my chance to do the oreo lesson!

I'm teaching one of our math for elementary education courses and the content includes measurement and statistics. I love measurement as a context which needs statistical understanding. Measurement introduces variability, and has a strong need for producing a number to represent typical. If the question is, "How tall is the ceiling?" then 2.60, 2.7, 2.725, 2.73, 2.735, 2.735, 2.74, or 2.76 meters is not a satisfying answer.

The oreo lesson, if you are unimaginably unfamiliar with it, is the brainchild of Christopher Danielson, aka @Trianglemancsd, the purveyor of much fine snack food mathematics. (All the oreo posts; this one is sort of a wrap up.)

Previous to this lesson, we investigated measurement, did an introduction to statistical typicals, and worked on statistical displays. (Two of those covered in a previous blogpost.) On the day before oreo day, I brought three packages of oreos to class: regular, double stuf, and mega stuf. Their interest was definitely piqued; it was like they could smell the sugar. Not much mathematical interest, though. So I prompted - what might a mathematician wonder about this? They immediately jumped to the idea of is it really double, and what is mega. Then we brainstormed together - what do we need to gather data on for the next day?

Their list:
OREO: data to collect
weight of the whole cookie
weight of white stuf in each cookie


height of each cookie (mm)
diameter of each cookie


weight of cookie/black sides
height of black cookie


height of white stuf
diameter of white stuf


how many of each size fit in a specific container/height


volume by displacement


compare deliciousness of different types


nutrition information
stuffing v serving size

calorie content (burning)
Not bad. Calorie burning turned out not to be viable with that short of a notice... but I'd like to see it! I made a data sheet, so that we'd have a whole class worth of data, and a google spreadsheet to share.


The points about measuring like a scientist (half of the smallest unit) and recording to show the accuracy measured are obviously still in progress. Also the statistical thinking of gathering and using data need more development - most were happy to answer the main question with just their measurement. "It's double." "It's more than double." "It's less than double." No one used the measurements, they went entirely by weight.

That wasn't what bothered me. I expect those kind of goals to take time.

What bothered me was that they weren't into it.

They were excited about the cookies, and figuring how many each person got, and eating the cookies afterward. But they weren't into the math.

Dave Coffey sometimes recounts (or makes fun of me for) how I want to be obsolete. Sitting back and watching students direct themselves at the end of the semester. I always want to hand off to the students. Have them make it their lesson. Look, here's a pile of data! On something interesting! What can you do with it? What else could we look into? How many ways can we come at the question?

But on this day, they said no.

My personal metaphor for this is a Smothers Brothers routine. (That's how old I am.)


(The whole brilliant bit... the show was amazing. Steve Martin got his start there as a writer, for example. They used their folk singing to make the show safe for sharp political commentary. Like we use math class as a ruse to get students problem solving and thinking critically. They were cancelled and replaced with Hee Haw.)

So this lesson felt like, "Take it, class!"
"No."

My response was to ask them to make sure they got all their group's data, and to write about the measuring and their answer to the question for a standards based grading assessment. And this is a compliant class, so they did, and did a good job on it. But that's far from the peak experience for which I was hoping with this lesson.

Part of the problem, I think, was in my desire for efficiency. By introducing the problem in the previous class and then making a record sheet, I took the initiative from them. They went into fill in the blank mode, from long habit in math class. Another part of the problem was lack of a focus, in the workshop sense. I think I should have discussed statistical thinking with them, and how that's different from single measurement thinking. It's all about the data! This is very reminiscent of the Barbie Bust. It was my problem and my lesson. "My" doesn't help me be a better teacher. (Gollum.)

Reflecting afterward, I think my high expectations helped create the sense of disappointment, like an overhyped movie.  And it led me to rush into a lesson instead of building suspense and anticipation.  I think this kind of experience contributes to teachers who "tried that once" and that was enough to turn them off of inquiry-based learning.  In the end it is the learning that needs to be the center of engagement, not the cookie.


Friday, October 11, 2013

Good Data Day

Nothing revolutionary here. Just what turned out to be a nice sequence of experiences with a group of preservice elementary teachers. No handouts, just a story and pictures of what happened.

Previously... we measured some distances, from a whiteboard marker to an outdoor commons. We discussed technique and accuracy, and I shared a bit on with what elementary students struggle. They went off and measured, and then we shared data in a Google doc. (New to some, somehow.) Choice 1 we agreed on as a class. Choice 2 was up to their group. Distance to the bathroom, trash bins, and one group was obsessed with how do they measure a bus. Then we talked about how do we go from all those different numbers to a specific measurement. How tall is a desk? We want a single number! Of course, they first go to the average.


I always push on that. One, because you need to justify, man! Always. The other because the mean is so inappropriate for low sample size because of the power of outliers.

Then last class was a day to explore  measures of central tendency. I love human statistical displays and it was a gorgeous day. (October in Michigan.)

First sort: height.

They naturally lined up this way. We found the median height, with some good discussion about 19 students, which was the middle and what if it was between two people. When the middle height person stepped forward, we talked about if she was a good representation of the typical height of student in our class. People were a little uncomfortable about that. Especially at the tall end of the line.

Second sort: age.
First take, they lined up like they did for height. We found the median and discussed how well she represented typical. People were curious about the twins, who were gracious to answer age questions. I asked if it was true that boys tended to be older than girls, which led to a comparison of the significance of their position in the height chart vs their position in the age chart.

Then I asked them to line up spaced for their age. Start at 19, each sidewalk section was 4 months. "What if we're the same?" "Just line up." "Oh, it's a line plot!"   Students sorted themselves within a month by age. So when we determined the median, we talked about whether to count from the front or back of that month's line.  They thought that this showed the data much better because of the gaps, and were surprised how old it made that ancient 22 year old look.

Third sort: name length.


Finally split up the twins! For this one, we added unifix cubes. They made a stack of cubes the height of their name, first and last as it is on their birth certificate, and used that for comparison. The new question - could we use the cubes to figure out the mean? Would the mean be higher or lower than the median? "We could lay them all down in a big line and divide it by 19!" (Literal adaption of the arithmetic rule is pretty typical.) "What does that do?" "Could we all just share to have the same?" "We have these left over... what do we do with them?" Then we discussed if that meant the mean was closer to 13 or 14. Why was it higher than the median?

Fourth sort: shoe size.

I gave them the option of what to sort, but they were too shy to say anything. When I say shoe size, they jumped at it, and several said they were thinking about that. I like the ambiguity between men and women's, and the apparent diversity from shoe size not varying perfectly with height. I wanted to use the cubes again, but how do we do that with half sizes? Two cubes for each half size... that works! This time they sorted themselves into a line plot without being asked, working out their own spacing.

Again the mean was higher than the median. Will that always happen? How would it be different if we added 4 cubes to the men's shoes?

Starbursts
As they came back inside, I distributed Starbursts, very unfairly. Enter your data on the board before you sit down. DON'T EAT THEM YET. (Only one person did. Not bad.)


We discussed the challenges of using candy in class. Sugar, red dye, communicated values. (Why are prunes the only individually wrapped healthy snack?)

I asked them to make a line plot and pie chart of this data. The group that shared had a very nice way to make their pie chart:take the 80 starbursts, and think about 20 per quarter. Then half that is 10, half that is 5. "But there's 81?" someone asked. The class agreed that this wouldn't change the pie chart much.

Next was the hard discussion. If we want to be fair, how many should each person get? 2, since that's what most people got? But if people contributed, then there would be enough for 3 each. Wait a second, there's enough for four for each of us. With some left over! I tried to make the connection between this idea of equal distribution and the mean. Here's where we want to take outliers into account.

(Unfortunately, I showed them a graph of US income distribution at this point. Probably should have skipped that. It is one of the reasons I think statistical education is important - we can't understand our world and society without it. What do you think?)

Finally we looked at one more way to make a pie chart.

You can see two wrappers there. We compared this to the pie chart on the board, and they said that the lines really helped and they would add them. But they agreed that the drawn chart was very close.

After that we discussed how to share them fairly. I shared that this was real problem solving. The textbook problem is 81 starbursts, 19 students, how many do each get. The real life problem includes messy things like people wanting particular colors.   We did a quick check of color preferences by going to the corners of the room. One corner each for red (30%), pink (25%), orange (15%) and yellow (5%).  Center of the room for no preference (25%). A few methods were suggested, then someone said we should just do rounds of taking one. People agreed and we started. They wanted to make the pie chart for each one and who am I to argue.


So it was a good data day. Statistics and sunshine, who could ask for more?

Next class: starting the glyphs project!

Sunday, October 6, 2013

Explore #MTBoS - What Makes It My Classroom

This is an interesting question. For Exploring the Math-Twitter-Blog-o-Sphere, we had two choices for Mission 1:
  • What makes my classroom mine?
  • What's one of my most open-ended or rich problems?
I try to write about my open ended and/or rich problems all the time.  The knots come to mind, the creative patterns lesson, a lesson that uses GeoGebra well, like the GGB Quadratics, or one of the games I love, such as Decimal Point Pickle. There's a dead simple triangle area lesson that has untold riches I should write up and I could do for this...

But the first question is the kind of reflection I only do if pushed.

<nudge>

It could be planning. Because I teach at a university, I have the priviledge and responsibility to plan each lesson, with time for revision and lots of original lessons. I try to share freely with colleagues and they give me feedback that there's a certain style that those have, and they seem to be able to guess which ones are mine. Of course, the style is probably just being goofy.

So it could be that I'm a goofball. I look in some respects like a serious, big, old guy, but wearing shorts, sandals and any funny math shirt I can get a hold of.  My first teaching emulation was David Letterman when I was a lecturer, and there are still traces of that. I use comics whenever possible, and it's a rare day that doesn't have at least one on an activity. I am encourage jokes and funny outbursts from students - it's not a raise-your-hand kind of classroom.

It could be technology. I have a Bring Your Own Device classroom and computer days where we look at math using free and open source tools like Desmos or GeoGebra or Wolfram|Alpha. I use Facebook and Google docs instead of Blackboard. I support students in using tech to capture and document their math and demonstrate it in the classroom. I read blogs with interest and use and adapt the ideas in my classroom; I make some of those posts required reading instead of stuffy journal articles for my preservice teachers. I do everything I can to encourage their blogging and use of twitter.

But I think what is essential, what is increasing more and more, and what represents what I hope to be as a teacher, is choice. The deeper I get into trusting students, and transferring responsibility to them, the more choice I give them. In class time, and certainly at home. In a pure content class, where the assessments are all about mastery of math skills and ideas, this means the choice of how to practice skills and apply ideas are up to them. Projects move from investigating my question to investigating their own. In teacher preparation classes, this semester I'm leaving everything up to them.

The always edgy Frog Applause

I give suggestions for homework and many take those, but they also in great percentage are choosing things of which I never would have thought. They are doing much more finding math in the world around them than I would have imagined. Doing more voluntary reading of good math ed articles. And definitely more creative work, though it's hard to think how to quantify it.  Students are uncomfortable with it, and frequently ask, "but what do you want?"  It feels like they're leaning away from that now.

This extends to assessments, where I provide more problems than needed, and they chooose their problems. Combined with Standards Based Grading, and they're choosing which standards they're trying to demonstrate, too. I often feel like our goals are just talk to students until it's connected to assessment. For more creative work, the choice in assessment comes from choosing exemplars of what constitutes their best work. 
thischarmingcharlie.tumblr.com

This goes against what Dan Ariely says about choice architecture. But I don't want to direct them here, I really want them to know freedom.

You can wander through the preservice elementary teachers' blogs for proof, if you're interested. No way would I have assigned some of that stuff. But it's theirs and they own it. More than in the past, anyway.

I hope to read  what makes your clasroom your own. Post your blogpost link at Exploring MTBoS. Don't have a blog? Maybe this is your <nudge>.

Sunday, September 8, 2013

Looking at My Inventory

I shared before about the math learning inventory I sometimes give. The greater the diversity of learners, the more inclined I am to give it. It surveys how students think they learn mathematics.

A basic break down of the learning preferences assessed follows from a Silver, Strong, Perrini and Tuculescu article, The Thoughtful Classroom:Making Students as Important as Standards.

  • Mastery learners want to learn practical information and procedures (what)
  • Interpersonal learners want to dialogue and collaborate (how)
  • Self-expressive learners want to use their imagination to explore (how)
  • Understanding learners want to learn why things work (what)
I do not think learning styles are determined for a student, but finding out what students think they prefer seems like a worthwhile preassessment to me. If I want to be a culture changer, I need to understand from what I wish to progress. The form I use is at Scribd, but I'm happy to email the Word document, too.

I thought I'd share how this semester's group of preservice elementary teachers look, and how that affects my planning. Mostly it doesn't change what I want them to experience, but it has a reasonably big impact on how I implement it. Also, with an education class, it's a chance to point out the tension between surface and core beliefs.


Yes, I put it in GeoGebra to help visualize. (I may have a problem. Here's the sketch if you want to use it to visualize your student information.)


Here's the most consistency. Students who feel like "tell me then I practice" is how to learn.  The challenge for this group is abstract or open-ended problems. Also known as all my favorite stuff in math. How I'm responding is to be explicit about what kind of problem we're working on, and support with structural suggestions. Like in working on trying to find all the pentominoes this week, I interrupted several times, solicited progress reports from groups ("They have 16?!"), and got them to share method and develop methods as a whole group.

Especially worrisome is when you compare my inventory with their composite. At the conference where I first saw this inventory I had a number of students.  They divided us up by table based on the results and I was alone! So I'm aware of my distance from students on this and how it can affect my persective.


Whoa. All over the place. This is a caution to me to not require group work always, and to look for ways to make space for some individual problem solving. Since relationship with teacher is part of this, I'm trying to be more personal to supplement for the people at the top end of this scale.


Very encouraging. Many times when learners have had negative math experiences this category can be quite low. I have to think about how to support those four students, though. So much of our class revolves around this kind of why thinking. And I feel that it is crucial for future teachers. I hope to have experiences that justify this approach to math. Maybe the way conceptual understanding furthers skill is the entry point?

 
Another one where the students are well spread out.  We started with a week long focus on creativity, that really got pretty good buy in from my perspective.  Again the students who do not favor this kind of learning are a challenge for me. Choice in assessment is part of the course structure, but that's probably not enough. What more can I do for them? Is it important for all teachers to be at least comfortable with this mode? 

Teacher-Student Alignment
Here's my graph compared with theirs. 
 
This probably comes through in the Mastery section above, but it's clear where I don't align with students. In some math classes I give choices for practicing content that can satisfy Mastery learners, but there's just not much of that for this class.  I'd welcome any suggestions here, is what I'm saying.

The view of all their regions at once also raises a concern about students who seem to have low responses across the board, as I think that's just overall discomfort with mathematics.

The goal with this post was to share what use I make of this information. If that didn't come through, or if you have ideas for more uses, please let me know!

Post Script: went through the survey with my 8th grader - very interesting discussion.  Discussing why he was answering what he did on the individual questions was enlightening. It makes me wonder about using this as an interview tool. Even for a student I know pretty well, we got to some new ground.

Post Post Script:  forgot to add the other questions' data. Even if it's mostly for fun, some illumination is to be had.

Motto
  • 16 - Show me how and let me practice.
  • 2 - I want to know why.
  • 1 - Let me play with it. (My choice)
  • 0 - Let’s talk about it and hear everyone’s ideas.
Assignment
  • 10 - p. 101: 1-39 odd
  • 6 - Draw a picture that shows the ideas. (My choice)
  • 3 - Work with a group to make a math skit.
  • 0 - Report on a math controversy.
I have to work to understand the mindset of 1-39 odd. Other than comfort with the situation you know.

Thursday, September 5, 2013

Flip Flop

Jennifer Silverman made this cool motions maze the other day. (More here.) We collaborated on it a little bit, after she did all the heavy lifting. I added buttons. (I may have a button problem.) It put me in mind of these motion puzzles I used to make in Geometer's Sketchpad, and I got to thinking how much better I could make them now. So I started, with the main new feature I wanted being the ability to generate new puzzles instead of being one static dynamic puzzle.


The user moves points A and B to try to find the line of reflection between the two flip flops. When you hit the Check button, it shows you the reflection over the line you're trying. 

What follows is my GeoGebra geek out over trying to make it look right. Here's the puzzle if you want to skip that: Flip Flop.

One thing I love about Jennifer's sketches are her excellent images. So I tried to step it up with some nice flip flops from openclipart.org.

It turns out the trickiest part was getting both sandals to always show up. That's why I'm writing this post. (A lot of my individual sketches I post at the tumblr.) The key to being able to do this is that in the graphics window you can put variables in for the window dimensions. Define those from the objects in the sketch, and,  voilà, you can see both the sandals. So I defined xmin, xmax, ymin and ymax from the two sandals. E.g.,
xmin=floor(Min[{0, x(F1'), x(F2'), x(F3'), x(F4')}]) - 1
But there's a problem then - the graphics won't be in 1:1 scale, which is always nice, but especially important for motions where the two objects should look congruent!

The Corner[ ] command is my new best friend. Corner[n] for 1, 2, 3 & 4 return the coordinates of those corners. Corner[5] returns a point with (width, height). Corner[image name, number] returns the corners of an image. This was handy for finding the corners of the reflection, F1' etc. in the command above. 
So using Corner[5] I could find out the aspect ratio of the graphics window. It took me a few minutes, but I hit on the idea of making the bottom left corner steady, and then altering the top right corner based on the aspect ratio. I defined r = y(Corner[5])/x(Corner[5]) (so, height:width) and:
  • xm = If[(ymax - ymin) / (xmax - xmin) < r, xmax, xmin + (ymax - ymin) / r]
  • ym = If[(ymax - ymin) / (xmax - xmin) < r, ymin + r (xmax - xmin), ymax]
If the sandals give a screen that's not wide enough, it uses the aspect ratio to find a suitable width. If the sandals give a screen that's not tall enough, it uses the aspect ratio to find a good height. (The If[ ] command works like If[condition, then, else], where the else is optional.

The puzzle, as it turns out, is pretty challenging. Give it a try, and let me know what you think. Or let me know an easier better way to do my GeoGebra graphics hacking.

Here's the teacher page for download or the mobile page.

EDIT: Bonus! Jennifer created an assignment to give it more structure as a lesson. (PDF in dropbox.)

Creative Pattern

So, like most semesters in most of my teacher prep classes, we started out by watching Sir Ken pose the question, "Do Schools Kill Creativity?" Especially for preservice elementary creatures, who often have trouble seeing themselves as math teachers, who often have had very negative math school experiences, and will even sometimes bust out with "I hate math" in front of their math teacher.

This semester's group got pretty into it: the story of Gillian Lynne was high impact, the idea that things need to change had traction, several recognized that they had been subject to this, and the desire to incorporate movement really resonated. (We have a drummer in class, so that might happen.) Some students wrote about creativity for their weekly work: Lauren and Kyrstin, for example.

One of the ways I'm trying to encourage creativity is a work structure (syllabus) like this:
Daily Work: I’m asking you for 1 hour per class. Document what you did somehow and keep in a binder. It is not evaluated on correctness, but on percent completed. Keep an index/table of contents for which days you have work for. This work should either be doing math or learning about the teaching of math.  It is okay to double dip - use daily time for Family Math or weekly work. Just keep track of getting in your hours. I will offer suggestions, but this is your responsibility. It’s a good opportunity to practice generating ways to meaningfully work, which will be an important part of your work as a teacher.

Creating: from our work each week I am asking you to put an additional hour or two into deeper work of your choice. Revise or extend a daily work, play or make a math game, make some math art, find and read something in an area of interest, work on a math problem of interest or create a mathematical task… there is so much different work that teachers do. If you can connect it to our course work, it’s probably okay. Each week’s work will get feedback in terms of our rubric and qualitative.  But those aren’t grades. At the end of the semester this weekly work will be evaluated ⅓ on completion (did you complete work for each week) and ⅔ on exemplars. You will pick two examplars of your doing math, and two examples of your preparing to teach math.
There's a urli.st of their weekly blogs The list helps me in finding them all for giving feedback, but I ask them to link posts to our Facebook group as well. That gets more readership amongst the class than I've ever had before. One of the purposes of blogging their work is to increase their sense of audience. So if you do take a peek, please comment!

The math content we paired with this is patterning. Our first activity (close to this previously blogged one) got us playing with the appropriately named pattern blocks, trying to get at the idea of what makes a pattern a pattern instead of a design. Our ultimate idea was that it needs to be extendable. Not necessarily predictable, but when you see what comes next it should make sense with what came before. They built and then we talked about repeating patterns and growing patterns and then sequential patterns. To emphasize the extendable idea, we built patterns, then rotated to have someone else add on. Clearly - time for pictures.
Clear to everyone
No discussion


People accepted extension,
but felt like 3rd red block
could go "anywhere"

Generated interest because
the start was in a line, and the
pattern was extended 2-dimensionally

Patter creator admitted they
didn't know what came next, but
liked the extension. Next: 3 blues
top and bottom.
Arguments! Pattern creator wanted the trapezoids
double each step, extender focused on blues
"adding one" each time.


Is this a pattern? Designer claimed it was just a design.
Extender felt like the red-blue-green were lines
extending out each direction. All agreed: lovely!
Here's the handout, if you're interested.

The next day I wanted to build on the idea of the sequential growing patterns with explicit connections to algebra. My colleague Pam Wells has the best activity I know for this, adapted from a Mathscape activity. Here's my version. (As a Word doc, if you want to edit. Wasn't displaying correctly...)


Everytime I've used it the lesson has been engaging, provoking discussion, and very supportive of symbolic representation with the visual. Students wanted to work through all the letters on the front, though I only asked them to pick a couple. Many wanted to jump to building their own pattern immediately. Most glossed over the verbal description, so I pushed for that. In general with our pattern work, visual to verbal has been uncomfortable. This is a good activity for the connection between rate of change and the symbolic rule, as several students made that jump. Some students went from data to rule, and some from the visual.

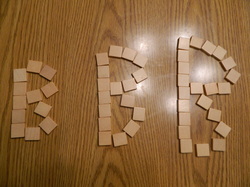
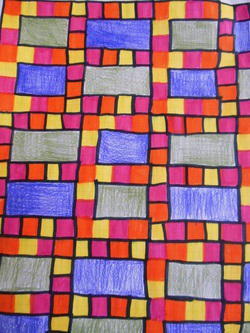
A couple students extended this for their weekly work. I based my sample weekly work on the letter patterns, so I expected more, actually; but that's why we give students choice. Brett extended the letter idea to his whole name, which is actually a pretty nice context for adding functions. (File that one away!) Emily did a really interesting project, making some mathart that  had layers of patterns.

The lesson after this was dominoes - but that's clearly a story for another day. Later in the semester we'll do more patterns using ideas of perimeter, area and volume.