Showing posts with label think aloud. Show all posts

Thursday, April 4, 2013

Sequential Circular Reasoning

I've been wanting to get better with the Sequence command in GeoGebra. It's a powerful tool for repetitive computation or construction, and math, of course, is full of the patterns. And then I saw...
#410 - Eights
From the perpetually fascinating Geometry Daily. Perfect opportunity for Sequencing.

First I dug into the geometry a bit. It seemed to me like the interesting bits were the 90ยบ turns and the constant (looking) increase in scale. That means you could do them as a series of dilations - but it was complicated to think about the centers of dilation. Probably better to just figure out the radius and center of each circle.  It seems important that the circles osculate - the kissing is a big part of the visual effect.

I was also thinking about what you could generalize, as that is the point of making it dynamic.It's also easier to build those things in as sliders at the beginning of a sketch than editing them in later. (Though it's not that much harder.) The angle between circles, the number of circles, the dilation ratio... pretty good start.

To build in the angle I just rotated the the circle defining point by the slider and the opposite of that angle. And then I made vectors in those two directions from the center of the circle.  I was thinking I needed those directions to build the new circles.  The radii of the new circles would just be a, a^2, a^3 if a is the scale.

Then came the messy thinking. The center of the first circle is a* the original radius in the direction of one of the points. Then the 2nd circle is.. the 1st radius plus a times that radius in the 2nd direction. I was working it out symbolically, but now that we've got a picture...

So thinking about the centers, I had to organize my data. Usually I scribble on an envelope, but didn't have one handy, so I used Word.
Pretty neat once I sorted it out. I decided to separate the circle centers by the two directions since it was really massy trying to come up with a single sequence to describe the pattern. The key here was the Sequence command.  (Quotes are from the GeoGebra Wiki.)

Sequence[ <Expression>, <Variable i>, <Number a>, <Number b>]
Yields a list of objects created using the given expression and the index i that ranges from number a to number b.
Example:
L = Sequence[(2, i), i, 1, 5] creates a list of points whose y-coordinates range from 1 to 5: L = {(2, 1), (2, 2), (2, 3), (2, 4), (2, 5)}.

A list is what you would expect:
Lists
Using curly braces you can create a list of several objects (e. g. points, segments, circles).
Example:

  • L = {A, B, C} gives you a list consisting of three prior defined points A, B, and C.
  • L = {(0, 0), (1, 1), (2, 2)} produces a list that consists of the entered points, as well as these nameless points.
Note: By default, the elements of this list are not shown in the Graphics View.

But I couldn't get it to work. I often try to do too much at once, so I decided to make a list of the powers of a, and then the coefficients of u and v. The relevant commands in GeoGebra are:
Element[ <List>, <Number n> ]
Yields the nth element of the list.
Example:
Element[{1, 3, 2}, 2] yields 3, the second element of {1, 3, 2}.
Append[ <List>, >Object> ]
Appends the object to the list.
Example: Append[{1, 2, 3}, 4] creates the list {1, 2, 3, 4}.
Append[ <Object>, <List> ]
Appends the list to the object.
Example: Append[4, {1, 2, 3}] creates the list {4, 1, 2, 3}.
 There is also Insert if you need more control than that.

So I defined my lists
  • ays = Sequence[a^(i), i, 1, N]
  • cofs = Append[0, Sequence[Sum[ays, k], k, 1, Length[ays]]] 
 It took a little monkeying around to get these next commands to work. I'm not sure if copying from Word was introducing extra characters or what. 
  • Sequence[B'_1 + Element[cofs, 2n] u + Element[cofs, 2n - 1] v, n, 1, 10] (list1)
  • Sequence[B'_1 + Element[cofs, 2n + 1] v + Element[cofs, 2n] u, n, 1, 10] (list2)
Then the circles are easy!
  • CirclesList1 = Sequence[Circle[Element[list1, n], r Element[ays, 2n - 1]], n, 1, N]
  • CirclesList2 = Sequence[Circle[Element[list2, n], r Element[ays, 2n]], n, 1, N]
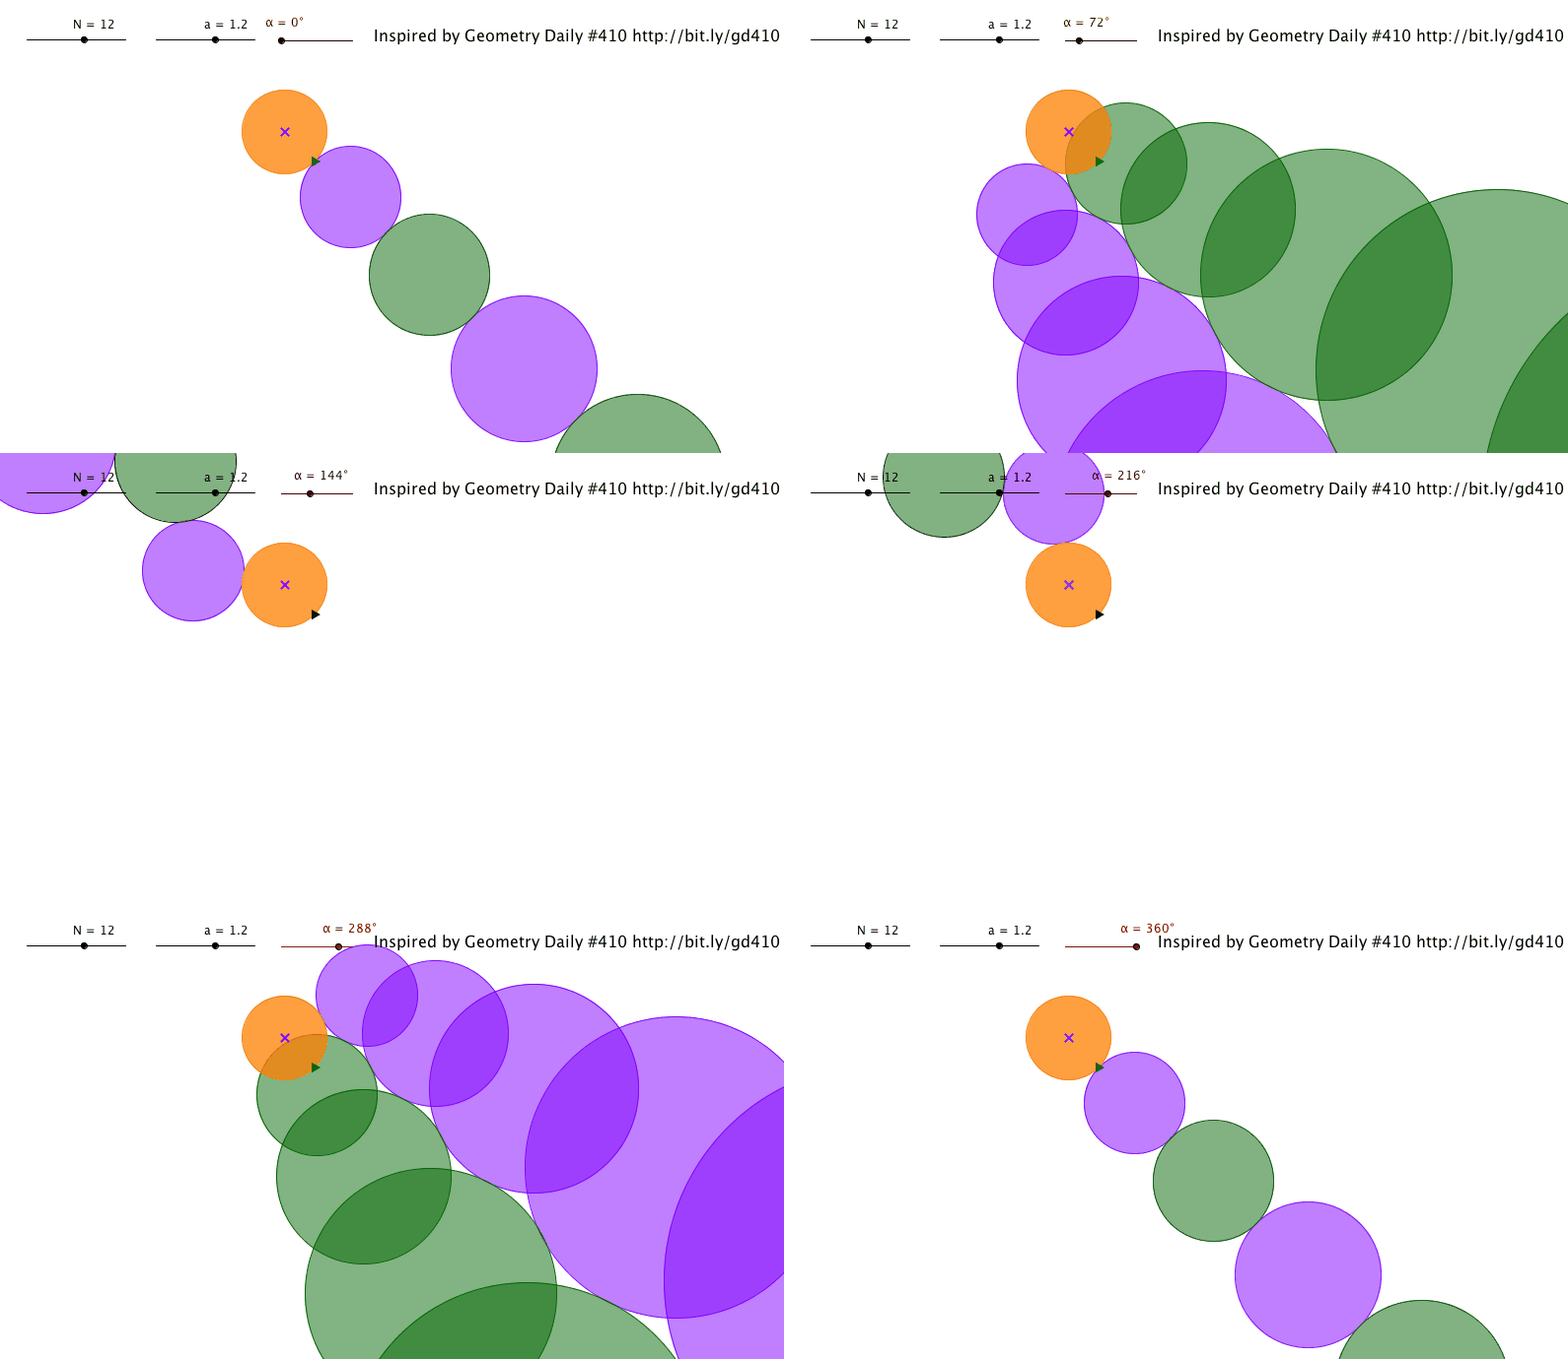
I'm pretty happy with the results. If you'd like to play with the result or remix it for yourself, it's on GeoGebraTube for download or as a mobile-ready applet.
Geometry Daily is a good source for GeoGebra inspiration, as well as good geometry, and just beautiful art. (Usually I put them on my Tumblr.)

Tuesday, September 25, 2012

Think Aloud: Planning Inequality

From the always fun Zappa Blamma
In my preassessment for preservice teacher (PST) high school mathematics course, I had a new topic grab their attention - inequalities.  In previous times teaching this course, that hasn't been an issue to which we've given much attention. My bad, as I've seen plenty of struggles with it in secondary classrooms. It's clearly an error where we retreat to instrumental understanding (using Skemp's terminology); rules, rules and more rules.

So what are the key ideas? It's an extension of the algebraic methods we're already using. So I want to focus more are the conceptual components of inequalities... which I haven't ever really deeply considered before.

The heart of inequalities is comparison, which is a key component of number sense. A key and often omitted component. Usually we introduce numbers (multi-digit, fractions, decimals, signed) and then are lucky if we even get representation work before we get to computation rules and rote. So that makes me think of a couple of my favorite games - Fraction Catch and Decimal Pickle. Probably not appropriate for a high school class, though I use them in the preservice middle school class to good effect. What would a high school version look like?

Hmm. It's the rules for changing the sign that get people all bothered. What if the players/teams started with a number, then multiplied or added to both players numbers... the goal could be to get the larger quantity in the end.  You could make special cards... or (I love being able to use regular dice, cards, dominoes, etc.) have the suits imply the operations. I'd have to think of how many turns, how many cards to have, some of the game mechanics. But that idea might be worth the work of developing something new.

Before being in math ed, I worked in index theory, that includes plenty of analysis. Analysis, as a mathematical field, involves a lot of estimates. Think nitty-gritty epsilon-delta proofs. This is less that that, which is less than or equal to the other, which means the whole thing is less than... I loved that stuff. So is there a way to get students making those kind of estimates?

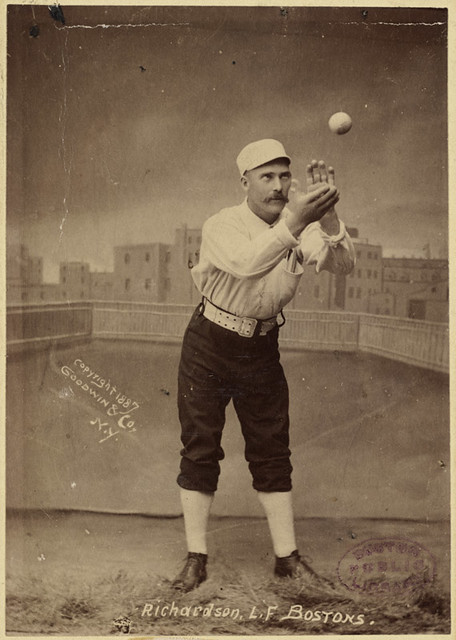
That makes me think about experimental error. Error analysis is nice because of the connections to measurement. That gets us into volume formulas. Could even do a guess how many kind of competition. Hmm. I took a picture of a neat set up like that at the ND-U of M football game over the weekend, but it came out too blurry. And I don't know the result! (I guessed 1337. [LEET.] The bottom pyramid was 10 balls wide and about 20 balls tall.) Lots of good images for that on 101qs.com. Could use in class or make a good HW assignment out of that, and get the PSTs looking at that great resource. It would also let us talk a bit about measuring technique - important to get in somewhere. Volume ties into some of the higher degree polynomial stuff we've been doing...

I think that would make for good foundational experiences, and then we could do a follow up day to see how the ideas of inequalities we see apply in traditional algebra and algebra 2 problems.

Now to get working on that game...

ps. What I didn't do here that I usually do when planning, is look around what other people have about inequalities. That usually involves a visit to Sam's virtual cabinet, searching reader, raiding Kate's archive, etc. Where do you look for inspiration, adaptation and out and out robbery? (Accredited, of course.)

This story continues in the post on coaching. With video of an actual dialogue!


Friday, April 20, 2012

Bouncing: GeoGebra Think Aloud

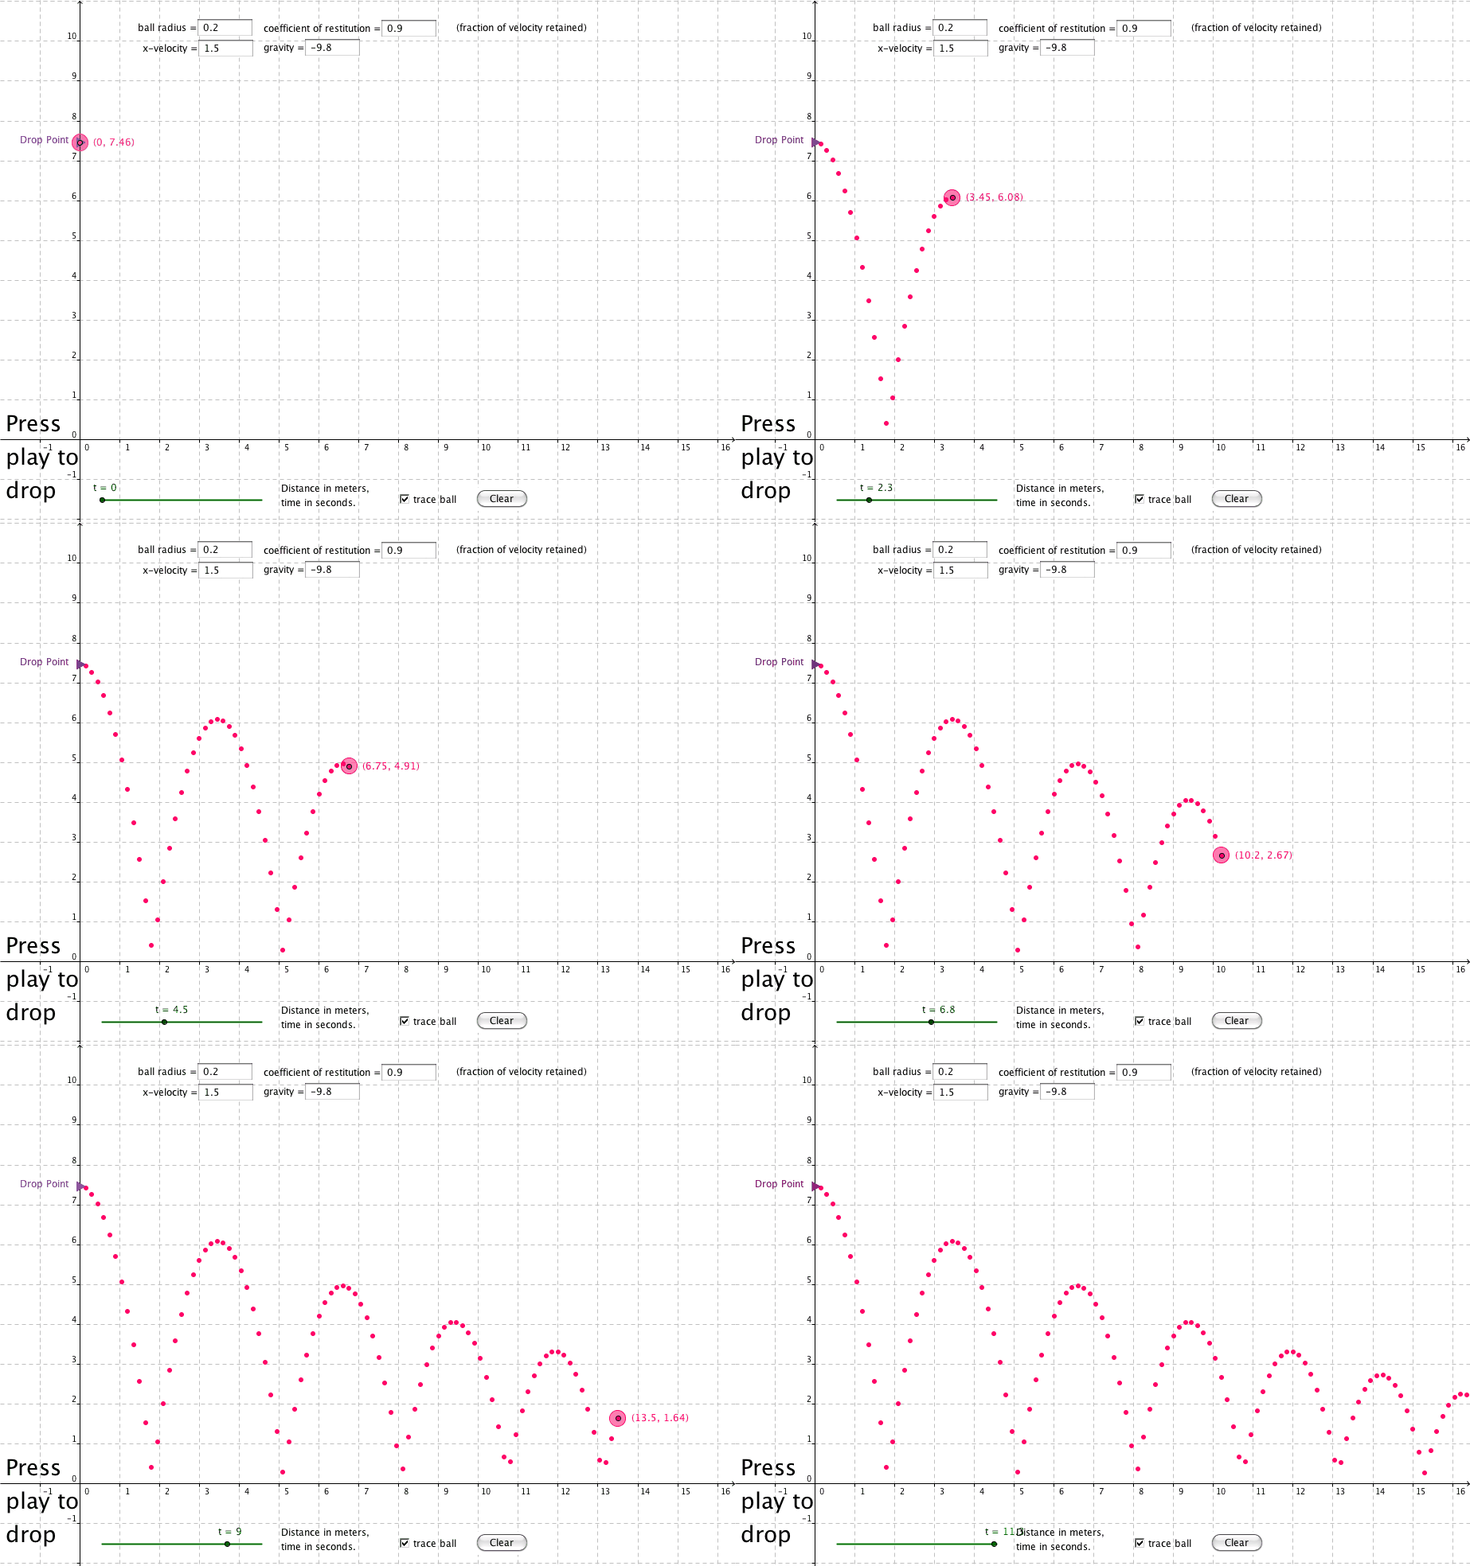
Following GeoGebra on Facebook or Twitter lets you see a lot of neat uses of the program. One recent one was this quick video of a ball bouncing under a table from Hugh Hunt.


There's lots to notice. I love how the ball starts spinning after impact. Is it physically accurate? There seems to be no gravity, making it more billiards. But the main thing for me is always "how did he do that?" The change of direction of the ball ... it's just a video as opposed to the sketch, so I had to skip the stage of monkeying around with the sketch, right to the "how would I do that?" stage.

Seems like a more natural problem for Scratch, where you can program the behavior of the ball. I was thinking about the problem with gravity, which always make me think about vectors. If you could parameterize the ball's motion... how would you have it react to boundaries? You need to have it switch somehow at that point...

I needed to think about a simpler problem. How to just draw a ball bouncing on the floor? I still don't know how to parameterize it (yet), but then you could just use a piecewise function... one way to define those in GeoGebra is with the If command; the third item in the bracket is the else result. For example:
f(x)=If[x<0,-x+3,If[x<3,3,x^2-6]]


Then I just have to solve when the bounce happens, to make the conditions for the piecewise function. As a beginning GeoGebraist, I would have plunged ahead here and then had to backtrack, but now I also think ahead of time about what I want people to be able to control. For this sketch:
  • time. To show motion in GeoGebra, my favorite technique is to use a slider. You can also animate sliders, which would help with the motion feeling. Initially I had this set for 20 seconds, but finally set it to allow for six bounces. You can set the limits of a slider to be a calculated quantity or a parameter that is set somewhere else.
  • gravity. The idea that students don't understand the difference between how things fall here and on the moon is one of my favorite examples of a misconception. Easy to build in.
  • ball size. I thought this might change students' perception of the resulting parabolas.
  • x-velocity. One of the math misconceptions I see most frequently about projectile motion is that all those height vs time graphs are height vs. horizontal distance. Maybe being able to control the horizontal speed will help with this. Set at zero, this is the experiment I do with algebra students to get a nice exponential pattern.
  • elasticity. How to model how bouncy the ball is? I made a parameter called elasticity, even though I knew that wasn't the physics typical terminology. Finally looked it up as the 'coefficient of restitution' I wanted it to be the portion of velocity that is retained, where I thought in physics I thought that they might actually measure the kinetic energy lost or something else. But it turned out that typically people do measure speed lost, especially for collision with a stationary object like the floor. (Found a neat little article by someone who got wondering if the coefficient of restitution was really a constant for a ball when I was investigating this.)
  • y-velocity. Do I want the ball to be dropped or thrown? I've already done some sketches to get at the projectile idea, and decided to omit it from this.
  • initial height. Have decided to make it a drop, it seemed like a good idea to let students control that, and it costs nothing in terms of complexity. Instead of an input box, it seemed more physical to have it be a point on the axis.

I programmed the first parabola, and then started to think about finding the time of impact and the speed at impact. That's still a job for pen and paper for me. Solving for the first impact point (when the height equals the ball radius) gives
$$ \frac{g {t_0}^2}{2}+h_0=r_{ball},\\
t_0 = \sqrt{2(r_{ball}-h_0) /g}$$.

The derivative (or formula for velocity, precalculus) gives the velocity at the first impact, modified by the coefficient of restitution, \( v_1 = eball \, g \, t_0\).

For the next parabola, the key to simplicity was to think about it as a graph transformation,
$$b_1(t)=\frac {g (t-t_0)^2}{2}+v_1 (t-t_0)+r_{ball}$$.
I was a bit surprised at how nice the expression for the next bounce point was, then:
$$(t-t_0)(\frac {g (t-t_0)}{2}+v_1)=0\\
t=t_0 \text{ or } t=t_0-2 v_1/g$$.
That's just nice! (Remember \(g\) is negative.)

Then the point for the ball is defined by using \(v_x \, t\) for the x-coordinate, and the piecewise-parabolas for the y-coordinate. I like how you can get the stationary drop by setting \(v_x =0\).
The tracing trick is one I use a lot. Define a new point equal to your old one, turn the trace on, and have the checkbox toggle which point is showing. (In the advanced settings, use the boolean variable, \( a \) in this sketch, for the tracing point, and the negation, \( \not a\), for the untraced point. The clear button is a trick that Linda Fahlberg shared, just a button with ZoomIn[1] as the GeoGebra script. I like the tracing so that the students have multiple ways to gather data, as well as for the nice visual.

Just a gif; Actual sketch

And then you've got your simulation! (Here's the teacher page on GeoGebraTube.) The recent update to the applet speed seems to make it much more reasonable to embed, but this one was a bit too big for the blogscreen.

I'd be interested in your feedback. Was this post helpful, or too obvious? Or did I not provide enough detail? It's also my first time using MathJax to display math, so please let me know if that is not working or is off putting. I'll be teaching algebra this summer, and will post notes on how the activity plays with students then.

Wednesday, August 18, 2010

Teachers vs Athletes


VS.


Whose side are you on?

I know this is silly.

I love quotes, so I have quotes of the day popping up in all sorts of places.  One today was:
"America believes in education: the average professor earns more money in a year than a professional athlete earns in a whole week." - Evan Esar
"More like in a minute," I think.  I tweet the quote and twask: Problem: how long does it take the average prof. athlete to earn the average annual teacher salary? Calling W|A!  (Mr. Esar is listed in wikipedia as a humorist.)

@SethBurn asked back: "@mathhombre Are minor league baseball player's professional athletes? How about women in the WNBA? AHL hockey? MLS soccer?"

Hmmm.  Admittedly I was thinking about MLB, NBA and NFL.  Onto  Wolfram|Alpha!

My first try was "average salary professional athlete" which got me the average US salary ($40,690/year).  One of the suggestions was "athlete salary" which returned this data.

people employed | 12670 people (1 in 10604)\nyearly change | +170 people  (+1.4%)\nmedian wage | $38440 per year\nmedian yearly change | -$2620 per year  (-6.4%)\n50% range | $ 21690 to $83150 per year\n80% range | $ 15210 to unknown\n(2007 data)
That's a lot of info.  To see all that for the future searches, just click on the search terms, which will take you to the W|A search page.

"average teacher salary" finds for all US education, training and library occupations, $46,610/year.  All right! Elementary teachers (a suggested search by W|A):  $50,040/year for 1.54 million workers.  Secondary teachers:  for $52,450/year for 1.06 million teachers.  It interpreted secondary to be highschool, so Middle School teachers: $50,630/year for 650,000 teachers. It occurs to me to ask for a comparison here: professional athletes vs teachers, which isn't much more informative.

So I calculate the average teacher salary (excluding special education and vocational teachers): (50040*1.54+52450*1.06+50630*.65)/(1.54+1.06+.65) = $50,944 as an average teacher salary.

What about the pro athletes?  I think the original Wolfram Alpha figure is interesting.  But what about the big time leagues?

Baseball: "average MLB salary" got the major league baseball teams, "average baseball salary MLB" didn't work (some results about the energy expenditures of playing baseball).  Can't get it to give me the number.  Finally googled it up: $2,944,556 in 2007, for 28 players*30 teams, 840 players; NFL $1.4 million in 2006 for 53 players * 32 teams, 1696 players; NBA $5,215,000 for 432 players.  (The 30 teams can have up to 15, but not all do.)  So the average major league professional salary: (2,944,556*840+1400000*1696+5215000*432)/(840+1696+432) = $2,390,000 for about 3000 professional athletes.

What about hockey?  I am a die-hard Red Wings fan, so it breaks my heart, but I don't think the NHL is a major professional sport in the US anymore.  And if the Wings are out, MLS is right out.

The original question involves breaking down by hourly wage.  Which raises the question of how many hours an athlete works.  I considered a lot of approaches, but ultimately decided that most pro athletes work year round now, considering conditioning, and long hours during a season.  Maybe.  So we'll consider the 50 weeks by 40 hours per week. About $1,195 per hour.  $50,944/$1,195 is about 42.

Like I shouldn't have known the answer would be 42?

Anyhow, that's about a week.  So congratulations on your estimate, Mr. Esar.