Showing posts with label lesson. Show all posts

Saturday, July 18, 2026

Math Performances

 I'm teaching a summer algebra course for incoming students. It's our intermediate algebra course stretched to two semesters, my first time teaching it. Part of it uses or parallels Stanford's How to Learn Math course. We work on number flexibility, patterns (a lot of visual patterns), graphing, proportional thinking, and linear functions and systems. It's part of our Oliver Wilson Scholars program, which works on community building, transition to college, and college success strategies, plus a start on math and english coursework. Each course has an assigned tutor who attends class and works with the learners directly for tutoring sessions. Lyndsey is our tutor and they are doing a smashing job.

In general, I love the graphing stories/lessons (web archive) from Dan Meyer. Of late, I've been doing them via Adam Poetzel's Desmos activity, but did find a current site with all the videos. For this class, I wanted something more experiential. Back in the days of TI calculators we had the motion detectors and I loved those walk the graph lessons. (How can we not have a motion detector app for smart phones?) Lyndsey thought of having groups perform for each other. I came up with four scenarios for them to do, and one that I could demonstrate. Distance of the head above the ground, distance from the edge of the whiteboard, distance between two people, and distance between a person and a ball.

Warm up was to try to guess the joke from this comic. They hadn't heard any of the expressions, but were able to use the 2nd and third graphs to guess at them.

I kept the 15 second time frame. I wanted movement that would be traceable at a classroom scale. I asked them to make it repeatable, and had them perform it twice. Once so people could see what was happening, and once for data. Instead of a hard 15 seconds, we had someone in the course count out loud. The most complicated performance was a minute with slow counting, but it didn't seem to bother anyone.

Here's the handout, with a couple questions revised after doing it. The screen for demonstration was pretty viewable. I wrote a script that I followed.

3 seconds pull down slow

Let go 2 seconds

Pull down fast 1 sec

Stay 3 sec

Put up half way 1 sec

Stay 1 sec

Slow up 4 sec


I got a little messed up with the counting, instead of 1 to 15! And there are some surprises trying to do anything in real life, so the practice was different from the data round.

We compared data, graphed the result, and compared the graph to what happened. One notice was that the graph was kind of the opposite of the motion, it went up when the screen came down. This is definitely a challenge with qualitative graphs, wanting the graph to somehow be a picture of what's happening. If you have a chance to have learners graph what happens to height above the ground when climbing and coming down a slide, you'll see what I mean.

Though I was nervous, new lesson, new course, it worked better than I could have imagined or had any right to have it go. They came up with creative movements, and it seemed to really help with an intuitive meaning to the graph because of the connection to the kinesthetic.

Here's the folder with all the videos

The sequencing worked out pretty well. I think the head above the ground was the easiest to understand, and the graph parallels the motion in a natural way. Distance from the edge of the whiteboard was easy to understand. Distance between people was fascinating, and I'd love to do that in a college algebra or calculus class to graph both positions and then the difference. The basketball was really surprising! I expected a much slower and varied trasfer, but the rapid passing gave them a lot to notice and made data collection a challenge.

They selected one of their graphs to turn in, answering an additional question about how does the graph show the action. Maybe I need to come up with a better way to ask that, but there were some good responses. A lot of understanding about data to graph, and some good understanding of the graph properties. Some confusion about minimum and maximum, which makes sense to me since there were two sets of data, really, the x and the y

The follow up the next day was Four Corners, a game for practicing coordinate graphing. Not a hit, but good practice. A couple pairs got really into it.

I'll definitely try this activity again, so if you have ideas to improve it or just to try... hit me!

Sunday, May 25, 2025

Star Patterns - a Mathart Lesson

One of my favorite courses to teach is our embedded elementary whole number and operation teacher prep course. Typically they teach every course day, twice a week. This semester, one section taught 1st and 3rd, and the other 2nd and 3rd. Pairs of teachers work with small groups of elementary learners for 30-50 minutes. Mostly our lessons are a number talk (or other instructional routine; WODB, same but different, Slow Reveal Graph, ...), a story problem and a game. But we try to do a couple of other formats, a three act lesson, a data collection lesson, etc.  At the end of the semester, I like to have a math and art lesson as a kind of celebration, and to get to experience making with the kids.

In the past, we've done Hundred Face (handout), but time-wise that was not going to work this year. I do recommend that lesson highly - always fun, so many ways to see 100 and think about exchanging different combinations to make the same number, great opportunity to do real art with significant restraints.

When I was thinking of a new lesson for the 1st and 2nd grades, I wanted something that involved counting, and could be done pretty quickly for the class with the time limit. 


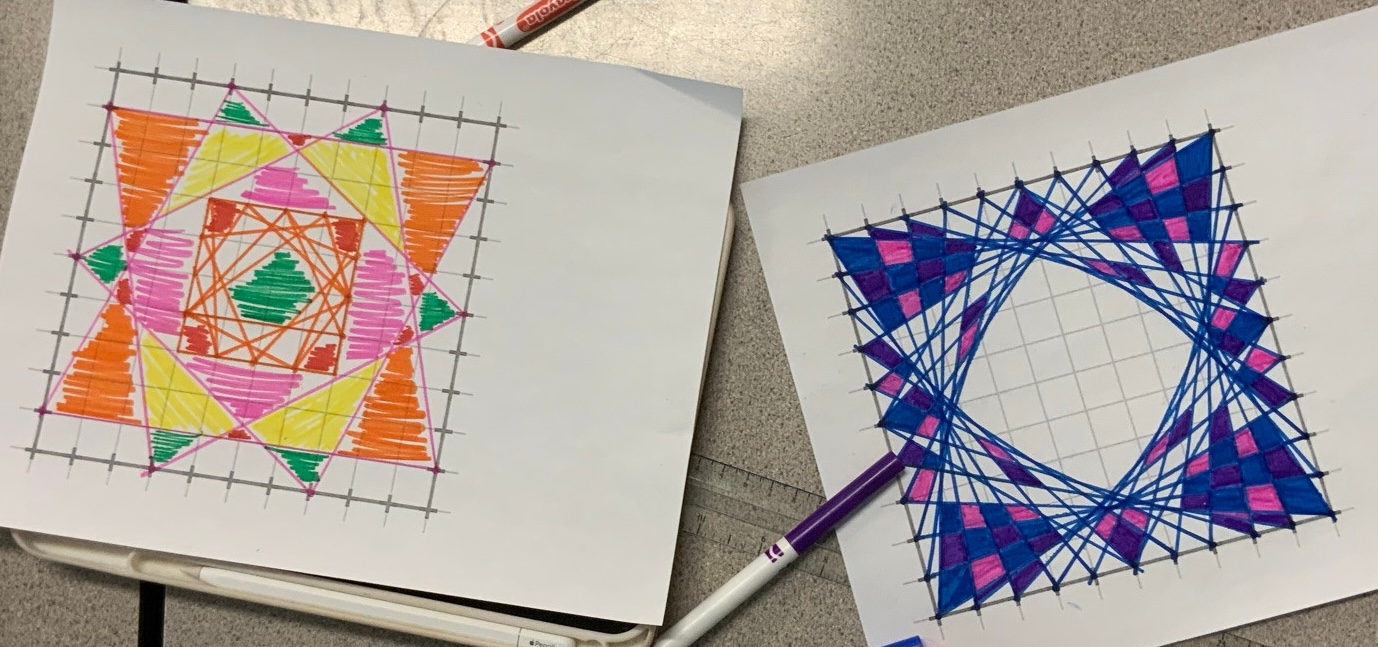
Eventually I landed on string art. I like this in general, I love all the things there are to notice. The mechanism is simple enough to communicate to young learners: choose a skip number and a place to start, connect those vertices, repeat. 

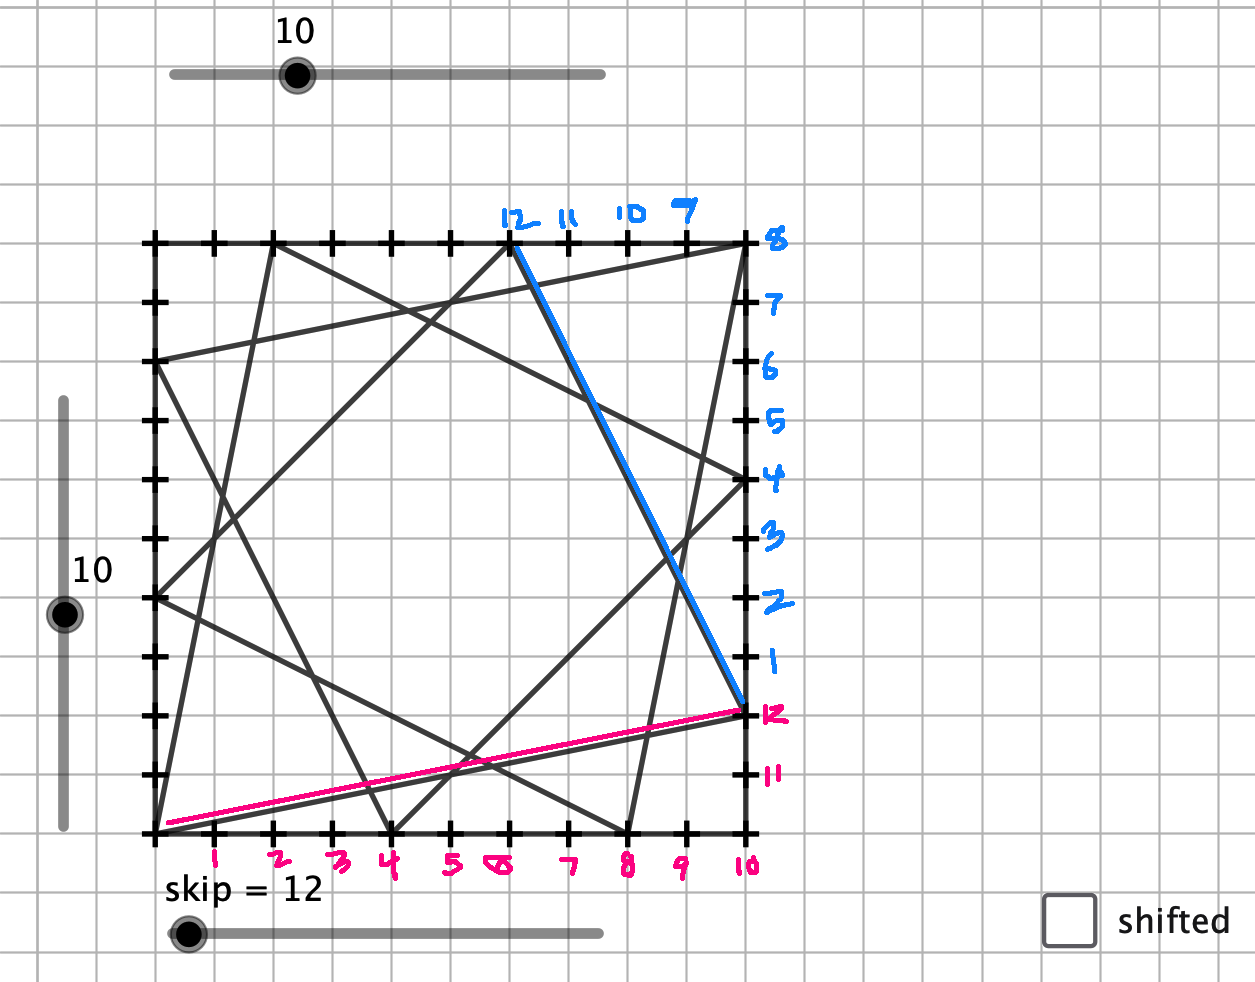
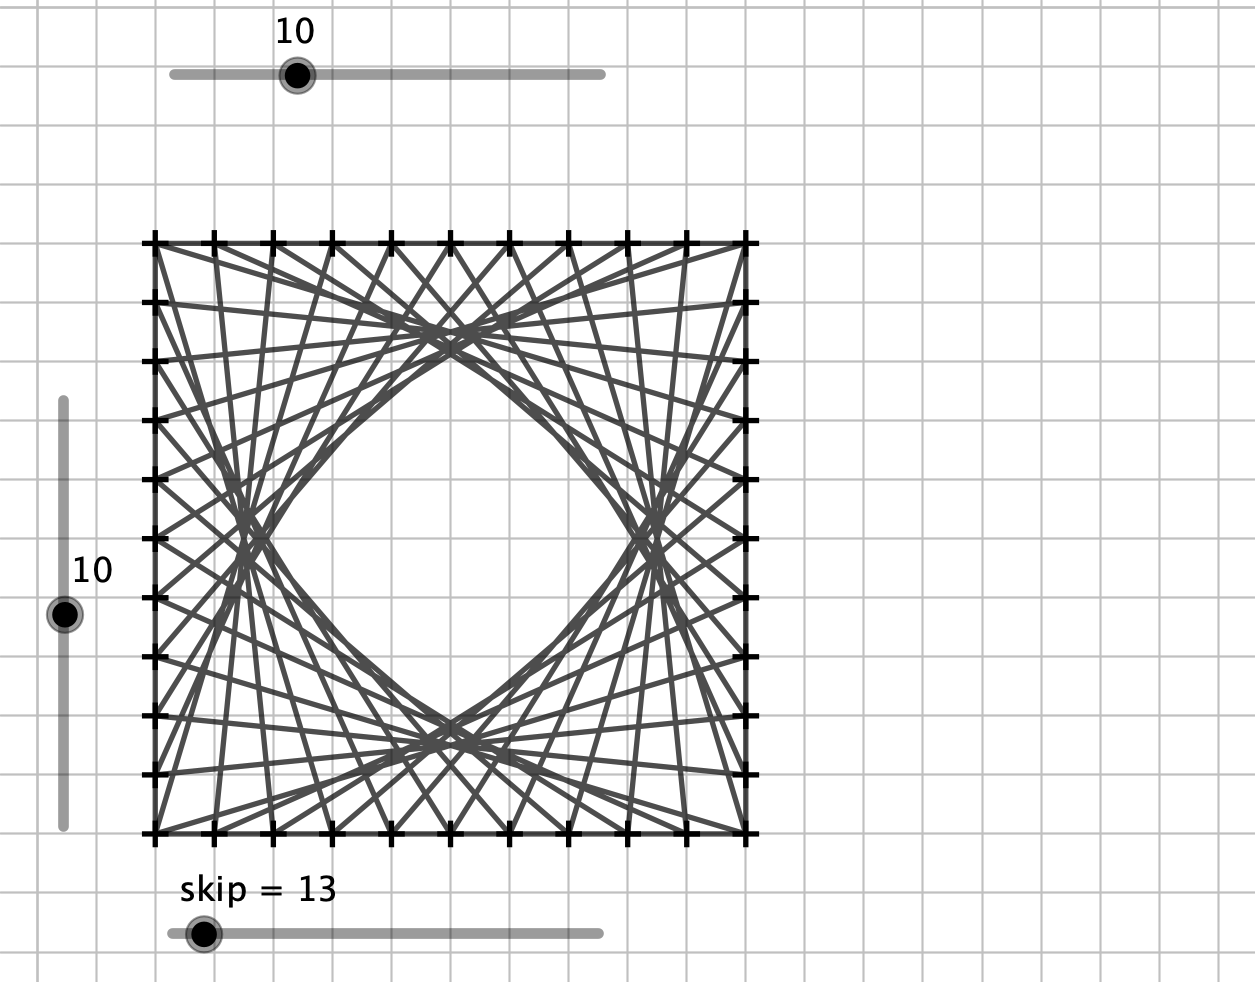
I made a GeoGebra applet for the teachers to play with, and, if time allowed, they could share with kids. We got the teachers to make some conjectures about the string art patterns from their noticing and playing. When does the pattern hit every node? When are there gaps? What difference does a smaller vs a larger skip number make?

For a couple years, I've been lucky to be able to do these lessons with the teachers during school spring break and have my son Xavier join us. He's a high school art teacher and the author/artist of our graphic novel. He talked to the teachers about line, as an element of art, and developed this slide show to share about Emma Kunz and Bridget Riley.

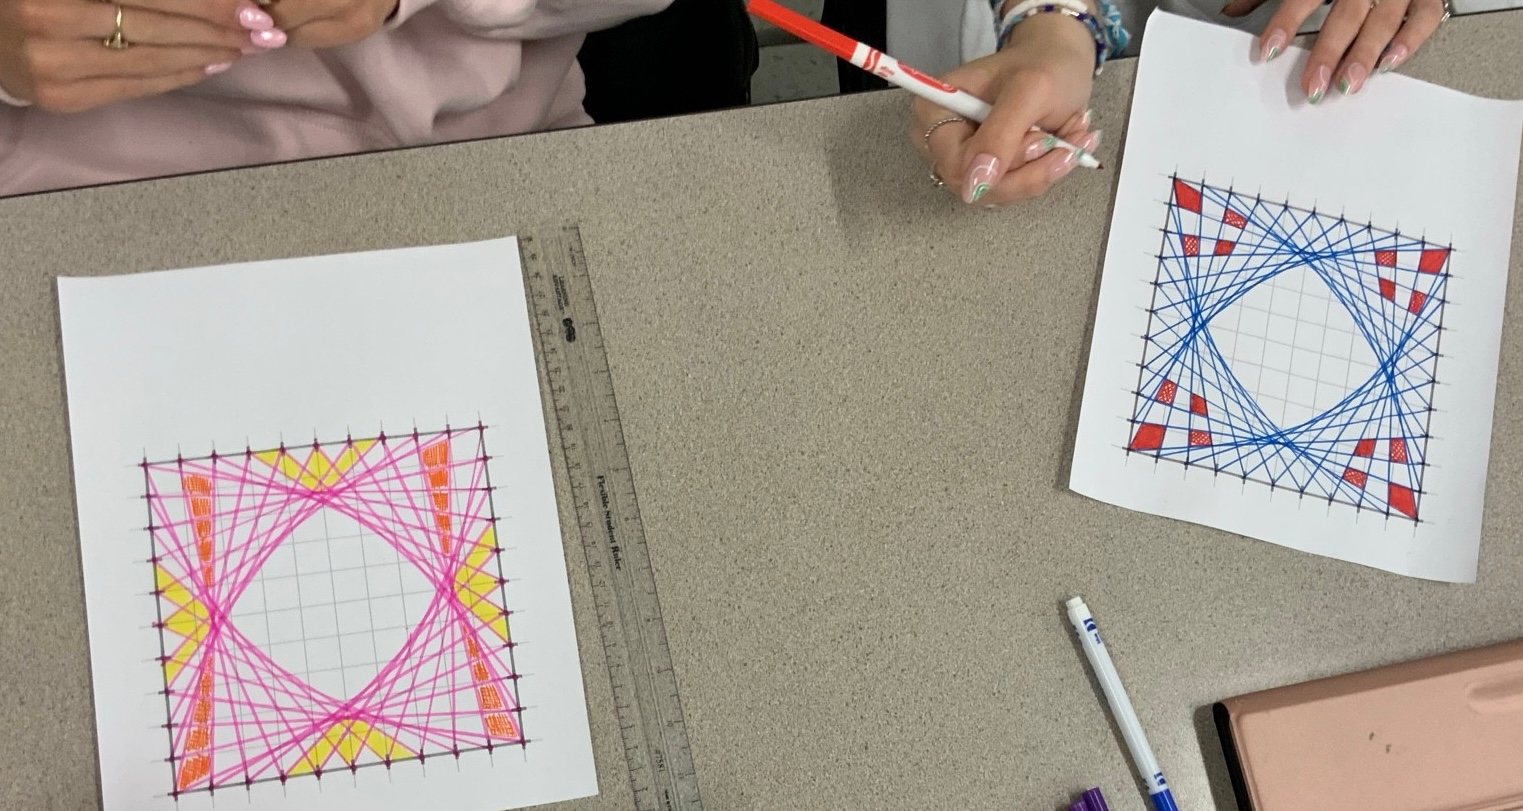
We talked about different ways to use the pattern to make art. Xavier suggested coloring so that not two adjacent areas shared a color.

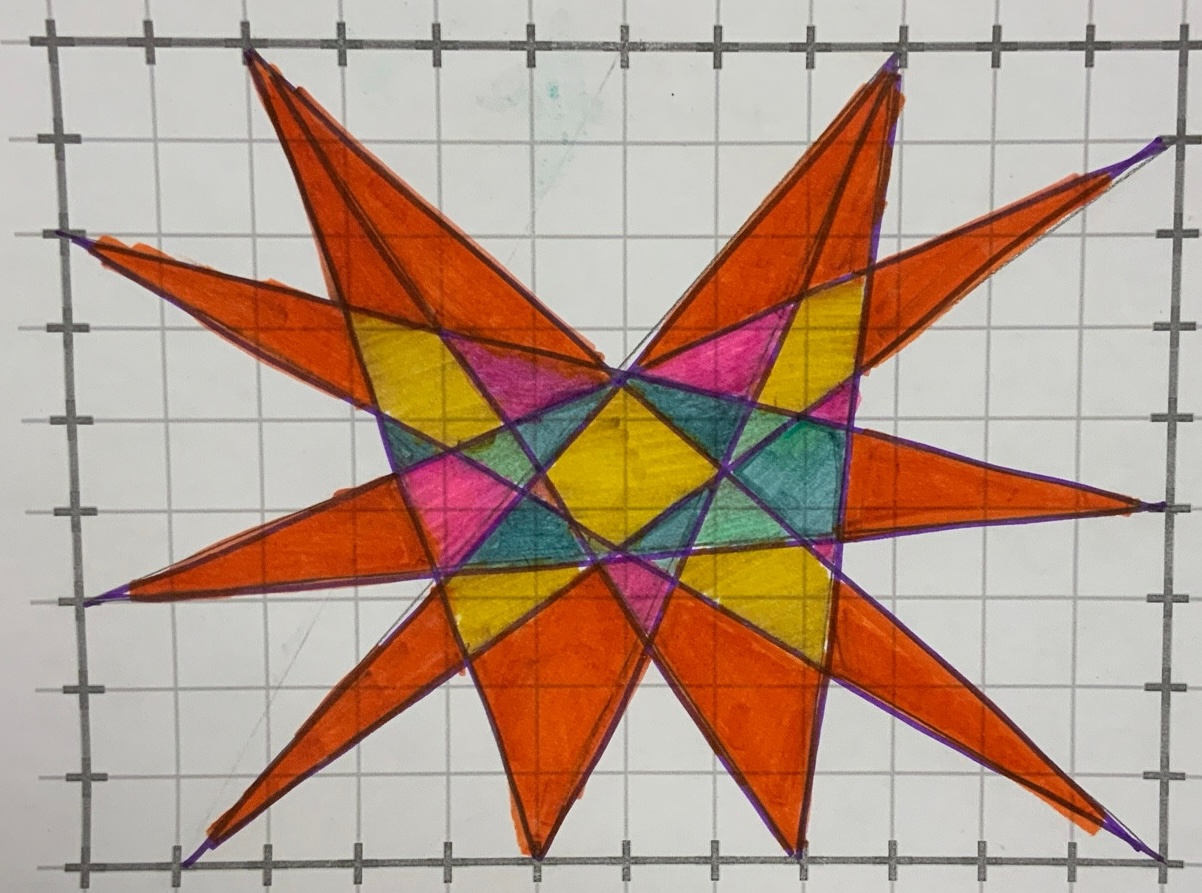
Teacher art was interesting:


One of the things that I love about combining math and art is being able to address mistakes as happy little accidents. We adjust, incorporate it, use fix up strategies.

The lessons went very well with the 1st and 2nd grades, most kids were highly engaged. When we finished, we set out all the art work and did a gallery walk. Then the artists shared something they liked about someone else's work. Lots of great noticing, and they were very pleased when another kid found something in their work. There were a lot of great predictions about where the count was going to take them next, and some kids were confident enough to just draw the pattern. The physical skills of using the ruler and coloring were relevant. Xavier had given the teachers some tips about careful coloring and precision.


Altogether, this is one I'll use again. It would be interesting as two part lesson in middle school, with the first an investigation into the patterns, with connections to factors and multiples. The math was great, and the preservice teachers were impressed with the kids' interest, focus and creativity. As usual, the art connection engaged kids who are less interested in traditional math lessons.

Lesson Plan Crib Notes

Part 1

Share your examples of rectangle string art. What do they notice and wonder?


Part 2

Have them pick a starting grid and a skip number. (Handout) Help them get the first few lines. As they work, see what they notice about the pattern. Help them use the grid to count - especially on the 10x10 square. The bigger a factor the skip number shares with the total perimeter (40 for 10x10, 42 for 9x12) the fewer lines until it meets up with itself. So skip 13 will hit every point, skip 12 will have fewer lines. Pick any starting point - some people like starting in a corner - and continue connecting lines to the point your skip number of points away. You can do colored lines, black ink or pencil. Talk to them about the counting math, patterns they notice, what they see. DON’T WORRY ABOUT PERFECTION.


Part 3

Decorate!


Summary

Find out what they like about their art. Get a picture. Tell them something positive that you saw about them or their work. Be authentic!